Candlestick patterns are essential tools in technical analysis, providing insights into potential price movements based on market sentiment and psychology. These patterns are formed by analysing the shapes, sizes, and positions of one or more candlesticks on a price chart. By identifying these patterns, traders can anticipate possible market trends, reversals, or continuations, making them valuable in short-term and long-term trading strategies.
Candlestick patterns can be broadly divided into two categories:
1. Single Candlestick Patterns
2. Multiple Candlestick Patterns
Single Candlestick Patterns:
Single candlestick patterns consist of just one candlestick. They tend to provide meaningful signals about the market's psychology. These patterns are often indicative of reversals or continuations in price trends.
Common Single Candlestick Patterns:
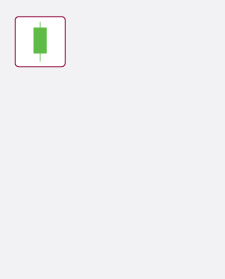
● Hammer
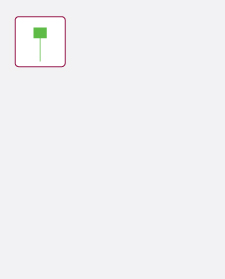
● Shooting star
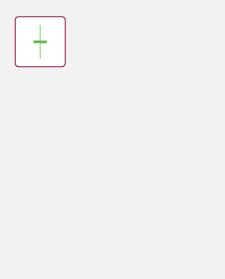
● Doji
Multiple Candlestick Patterns:
Multiple candlesticks patterns are formed by analysing two or more consecutive candlesticks. These patterns are generally considered more reliable because they incorporate more data points, allowing traders to interpret market sentiment with greater confidence.
Common Multiple Candlestick Patterns:
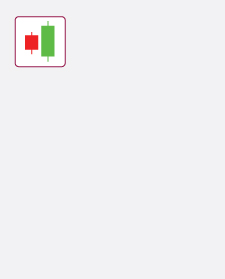
● Engulfing Patterns
● Bullish Engulfing
● Bearish Engulfing
● Harami Patterns
● Morning Star and Evening Star
● Three Soldiers and Three Crows
Tips for Using Candlestick Patterns
● Consider the trend context: candlestick patterns are more meaningful when analysed within the prevailing trend.
Axis Direct Disclaimer:
This is for educational purposes only. Axis Direct is a brand under which Axis Securities Limited offers its. Retail broking and
investment services. Investments in the securities market are subject to market risks. Read all the related documents carefully
before investing. Disclaimer & Statutory Information


 India
India NRI
NRI