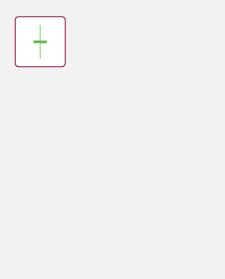
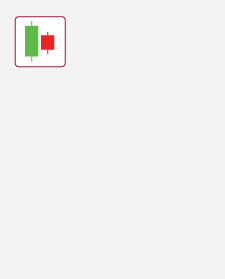
TCS opened at ₹4450. Throughout the day, it fluctuated within a range of ₹4500 to ₹4400, as buyers and sellers battled for control. By the end of the session, the stock returned to its opening level, closing around ₹4460. Notice that this close is around the opening price, which means a Doji with a very small real body has now formed.
The Doji is a unique formation, characterized by its narrow real body, where the opening and closing prices are nearly identical. In the above example, the close could have also ended below the open, but around it.
This pattern reflects market indecision, as neither buyers nor sellers managed to gain the upper hand during the session. It highlights a moment of equilibrium, often serving as a signal for a potential reversal or continuation, depending on the prevailing trend.
Axis Direct Disclaimer:
This is for educational purposes only. Axis Direct is a brand under which Axis Securities Limited offers its. Retail broking and
investment services. Investments in the securities market are subject to market risks. Read all the related documents carefully
before investing. Disclaimer & Statutory Information


 India
India NRI
NRI