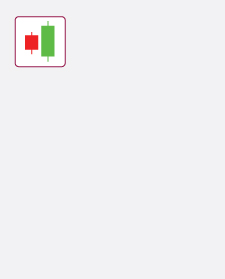
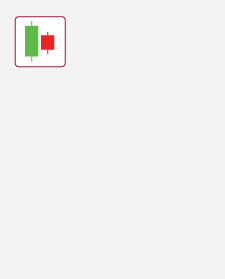
HDFC Bank has been in a downtrend, with sellers firmly in control. On one particular day, the stock formed a bearish candle, closing at ₹1800 after registering a high of ₹1870 and a low of ₹1780. In the next session, the stock opened lower at ₹1750, but buyers stepped in aggressively, driving the price higher. By the end of the session, HDFC Bank closed at ₹1920, forming a strong bullish candle that completely engulfed the previous day’s bearish candle.
The outcome is a candlestick pattern known as a Bullish Engulfing, defined by a large bullish candle that completely “engulfs” the prior bearish candle. Note that the engulfing only involves the “real body” and the shadows or wicks don’t matter.
This pattern signals a significant shift in market sentiment as intense buying pressure overwhelms sellers. The bulls’ ability to erase the previous day’s losses indicates that the downtrend could be losing momentum, creating the potential for a bullish reversal.
For traders, the Bullish Engulfing pattern often acts as a reversal pattern that has the potential to reverse the downtrend.
Axis Direct Disclaimer:
This is for educational purposes only. Axis Direct is a brand under which Axis Securities Limited offers its. Retail broking and
investment services. Investments in the securities market are subject to market risks. Read all the related documents carefully
before investing. Disclaimer & Statutory Information


 India
India NRI
NRI