Reliance Industries had been in a steady downtrend for the past five sessions, with prices falling consistently. On one particular day, the stock opened at ₹1300 after closing higher during the previous session, hinting at yet another bearish session. During trading hours, the price plummeted further, reaching a low of ₹1250, reinforcing the bearish momentum and leading many to expect the downtrend to persist.
Suddenly and without warning, buyers stepped in aggressively at lower levels, viewing the sharp drop as an opportunity to accumulate the stock.
Their collective efforts pushed the price back up, and by the end of the day, Reliance closed at ₹1320—above its opening level.
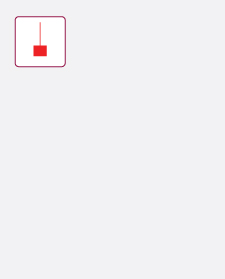
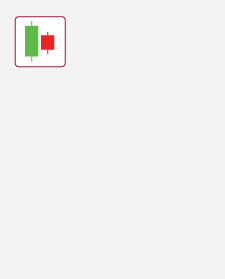
The outcome is a distinctive candlestick pattern known as a Hammer.
It is marked by a small real body near the top of the day’s range
and a prominent, long lower shadow.
The long lower shadow reflects intense selling pressure earlier in the day. However, the strong recovery that results in prices closing near the opening price reveals a significant shift in market sentiment.
This shift in dynamics often signals that the prevailing downtrend could be losing steam and that a significant reversal might be around the corner.
Similar concepts:
Technical Analysis | OHLCV | Line Chart | Bar Chart | Candlesticks | Trend Analysis | Candlestick Patterns
Axis Direct Disclaimer:
This is for educational purposes only. Axis Direct is a brand under which Axis Securities Limited offers its. Retail broking and
investment services. Investments in the securities market are subject to market risks. Read all the related documents carefully
before investing. Disclaimer & Statutory Information


 India
India NRI
NRI