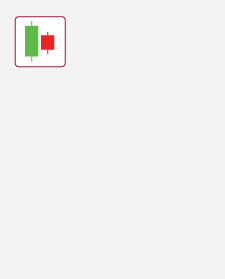
HDFC Bank had been in a persistent downtrend,
with sellers maintaining control. On one
particular day, the stock formed a large bearish
candle, closing at ₹1850 after reaching a high of
₹1890 and a low of ₹1830. In the next session,
the stock opened higher at ₹1860, showing early
signs of resistance to further selling pressure.
Despite some volatility, the price remained
contained within the range of the previous bearish
candle, eventually closing at ₹1870, forming a
small bullish candle
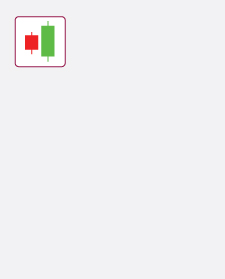
This price action resulted in a candlestick pattern known as a Bullish Harami, characterized by a smaller bullish candle that fits entirely within the "real body" of the prior bearish candle.
This pattern signals a potential shift in market sentiment, as the second candle reflects hesitation among sellers and the emergence of buying interest. This subtle change suggests that the downward momentum may weaken, paving the way for a potential reversal to the upside.
For traders, this often indicate a reversal in a downtrend, prompting them to watch for further confirmation of bullish momentum in subsequent sessions.
Axis Direct Disclaimer:
This is for educational purposes only. Axis Direct is a brand under which Axis Securities Limited offers its. Retail broking and
investment services. Investments in the securities market are subject to market risks. Read all the related documents carefully
before investing. Disclaimer & Statutory Information


 India
India NRI
NRI