


 India
India NRI
NRISeries 20: Tweezer Bottom Pattern
Jan 15, 2025

Series 20:Tweezer Bottom Pattern
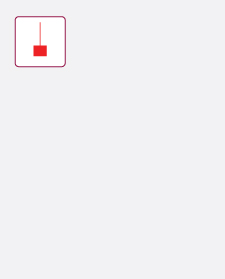
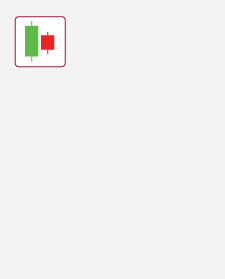
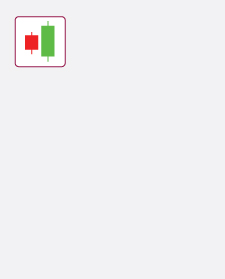
ICICI Bank had been in a steady downtrend, with sellers maintaining control and driving the stock price lower. The stock formed a large bearish candle on one particular day, reflecting continued selling pressure and reinforcing the downward momentum.
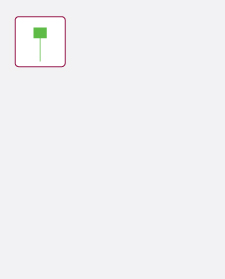
In the following session, the stock opened flat, and strong buying interest was witnessed at the previous day's low. The price rallied sharply, forming a large bullish candle that closed near the session's high, making the prior day's low as a key level of support.

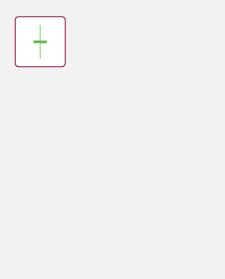
This two-candle structure forms the Tweezer Bottom pattern, where both candles show nearly identical lows, indicating strong buyer interest at that level.
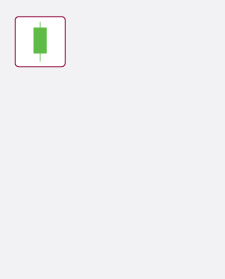
This structure signals a potential reversal from a downtrend to an uptrend. The first bearish candle represents selling dominance, while the second bullish candle shows buyers stepping in decisively at a critical support level.
The Tweezer Bottom pattern is a sign of a potential bullish reversal for traders. Confirmation from subsequent sessions with higher closes can provide additional confidence before entering long positions.
Similar concepts:
Technical Analysis | OHLCV | Line Chart | Bar Chart | Candlesticks | Trend Analysis | Candlestick Patterns | Hammer Candlesticks | Doji Candlestick | Bullish Engulfing | Bearish Engulfing | Bullish Harami | Bearish Harami | Morning Star | Evening Star | Three White Soldiers | Three Black Crows
Axis Direct Disclaimer: This is for educational purposes only. Axis Direct is a brand under which Axis Securities Limited offers its. Retail broking and investment services. Investments in the securities market are subject to market risks. Read all the related documents carefully before investing. Disclaimer & Statutory Information
Related Keyword
Technicals
Options
Call Centre
Put Option
Futures
TechnicalAnalysis