


 India
India NRI
NRISeries 30: ADX
Jan 30, 2025
Series 30: ADX
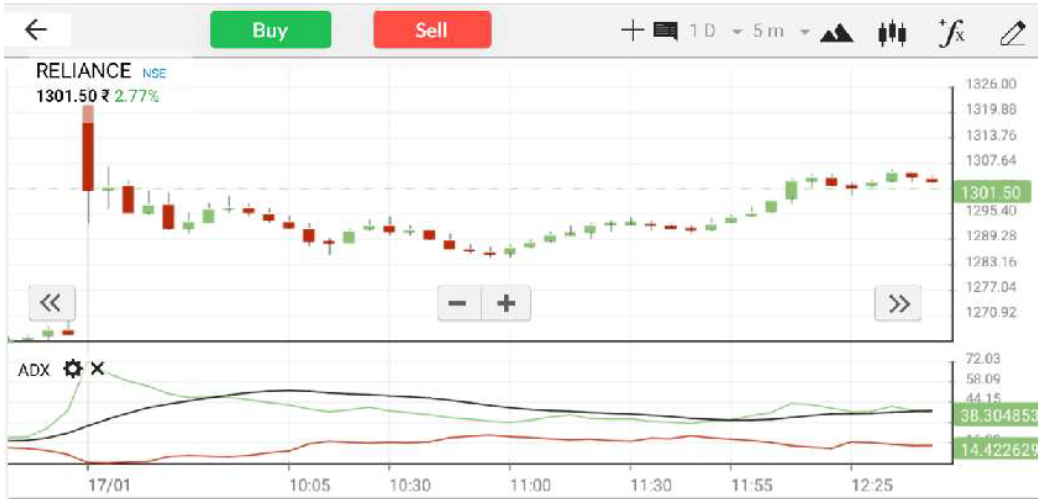
The Average Directional Index (ADX) is a popular trend strength indicator used in technical analysis to measure the strength and momentum of a trend, regardless of its direction. It helps traders identify whether a market is trending or ranging and assess the strength of the trend. The ADX is part of the Directional Movement System, which also includes the +DI (Positive Directional Indicator) and -DI (Negative Directional Indicator).
The ADX is calculated using the following components:
1. +DI (Positive Directional Indicator):
● The +DI measures the strength of upward price movement over a given period.
2. -DI (Negative Directional Indicator):
● The -DI measures the strength of downward price movement over the same period.
3. ADX (Average Directional Index):
● The ADX is a smoothed moving average of the Directional Movement
Index (DMI), which is the absolute difference between +DI and -DI divided
by their sum.
How is the ADX Calculated?
The ADX formula is calculated using the following components:
Directional Movement (DM):
+DM = Current High - Previous High (if positive and greater than Current Low -Previous Low, otherwise 0)
-DM = Previous Low - Current Low (if positive and greater than Current High -Previous High, otherwise 0)
True Range (TR):
TR = Maximum of:
(Current High - Current Low) or Absolute (Current High - Previous Close) or Absolute (Current Low - Previous Close)
+DI and -DI:
*Smoothed values mean simple moving averages (normally 14 day)
+DI = (Smoothed* +DM / Smoothed* TR) × 100
-DI = (Smoothed* -DM / Smoothed* TR) × 100
Directional Movement Index (DMI):
DMI = ABS(+DI) - (-DI) / (+DI + -DI)
ADX:
ADX = Smoothed Moving Average of DMI over a specified period (commonly 14 days).
Example: Reliance Industries
Step 1: Calculate +DM, -DM, and TR
Assume the following:
Current High = ₹2500, Previous High = ₹2480
Current Low = ₹2450, Previous Low = ₹2460
Previous Close = ₹2470
+DM = ₹2500 - ₹2480 = ₹20 (since it is positive and greater than Current Low -
Previous Low)
-DM = ₹2460 - ₹2450 = ₹10 (since it is positive and less than Current High -
Previous High)
TR = Maximum of:
₹2500 - ₹2450 = ₹50
|₹2500 - ₹2470| = ₹30
|₹2450 - ₹2470| = ₹20
TR = ₹50
Step 2: Calculate +DI and -DI
Assume Smoothed +DM = ₹15, Smoothed -DM = ₹10, and Smoothed TR = ₹40:
+DI = (₹15 / ₹40) × 100 = 37.5
-DI = (₹10 / ₹40) × 100 = 25
Step 3: Calculate DMI
DMI = |37.5 - 25| / (37.5 + 25) = 12.5 / 62.5 = 0.2
Step 4: Calculate ADX
Assume the smoothed moving average of DMI over 14 days is:
ADX = 20
How to Interpret the ADX?
1. Trend Strength:
- ● ADX below 20: Indicates a weak or non-trending market (ranging or sideways).
- ● ADX between 20 and 40: Indicates a moderate trend.
- ● ADX above 40: Indicates a strong trend.
- ● Directional Indicators (+DI and -DI):
2. Trend Direction:
- ● +DI > -DI: Indicates an uptrend.
- ● -DI > +DI: Indicates a downtrend.
3. Crossovers:
- ● When +DI crosses above -DI, it signals a potential bullish trend.
- ● When -DI crosses above +DI, it signals a potential bearish trend.
Key Points to Remember:
- ● The ADX measures trend strength, not direction.
- ● +DI and -DI indicate the trend direction.
- ● The ADX is a lagging indicator because it is based on historical price data.
- ● The ADX works best in trending markets and may give false signals in choppy or sideways markets.
- ● Combine the ADX with other indicators, candle patterns etc.
- ● The ADX does not have overbought or oversold levels, unlike the Stochastic Oscillator.
Disclaimer: This information is for educational purposes only. Consult a financial advisor before engaging in such trading activities.
Axis Direct Disclaimer This is for educational purposes only. Axis Direct is a brand under which Axis Securities Limited offers its. Retail broking and investment services. Investments in the securities market are subject to market risks. Read all the related documents carefully before investing. Disclaimer & Statutory Information
Related Keyword
Technicals
Options
Call Centre
Put Option
Futures
TechnicalAnalysis