Tap here to access menu...

Tap here to Pull quick market snapshot...

Tap here to open an account...
Welcome to our brand new version...
Tap here to access menu...
Tap here to Pull quick market snapshot...
Tap here to open an account...
Welcome to our brand new version...

Advantage AxisDirect
Quotes
Back To Menu
Jan 26, 2025

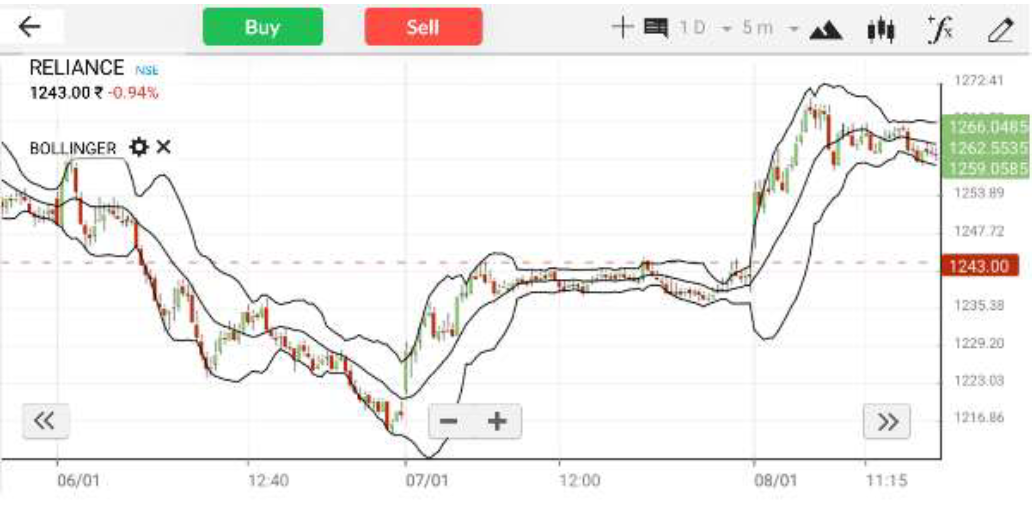
Bollinger Bands are a popular technical analysis tool used by traders to measure market volatility and identify potential overbought or oversold conditions. Developed by John Bollinger, this indicator consists of three lines plotted on a price chart: a simple moving average (SMA) in the middle, and two bands (upper and lower) that are placed at a certain number of standard deviations away from the SMA. These bands expand and contract based on market volatility, helping traders make informed decisions.
The key idea behind Bollinger Bands is that prices tend to stay within the upper and lower bands. Technically, prices are relatively high when they're above the upper band and relatively low when below the lower band. However, “relatively high” should not be regarded as bearish or a sell signal. Likewise, “relatively low” should not be considered bullish or a buy signal. Prices are high or low for a reason. As with other indicators, Bollinger Bands are not meant to be used as a stand-alone tool. Chartists should combine Bollinger Bands with basic trend analysis and other indicators for confirmation.
How Are Bollinger Bands Calculated?
Middle Band: This is simply a moving average (usually a 20-day SMA).
Upper Band: The middle band plus 2 standard deviations of the price.
Lower Band: The middle band minus 2 standard deviations of the price.
The formula for the upper and lower bands ensures that they adjust dynamically to
market volatility. When volatility increases, the bands widen, and when volatility
decreases, the bands contract.
Example: Reliance Industries
Let’s assume the closing prices of Reliance Industries for the past 5 days were as follows:
Day 1: ₹1200
Day 2: ₹1210
Day 3: ₹1225
Day 4: ₹1230
Day 5: ₹1215
Step 1: Calculate the 5-Day Moving Average (Middle Band)
We calculate the 5-day SMA as follows:
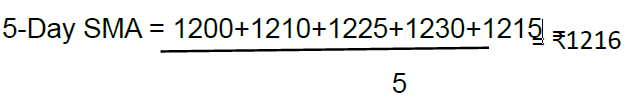
So, the middle band is ₹1216.
Step 1: Calculate the Standard Deviation
The standard deviation measures how much the prices deviate from the average.
For simplicity, let’s assume the standard deviation of the above prices is ₹12.
Calculate the Upper and Lower Bands
Upper Band = Middle Band + (2 × Standard Deviation)
Upper Band=1216+ (2×12) =₹1240
Lower Band = Middle Band - (2 × Standard Deviation)
Lower Band = 1216 − (2×12) = ₹1192
Thus, the Bollinger Bands for Reliance Industries are:
Upper Band: ₹1240
Middle Band: ₹1216
Lower Band: ₹1192
How to Interpret Bollinger Bands?
1. Squeeze:
2. Trend Confirmation:
3. Walking the Bands:
Disclaimer: This information is for educational purposes only. Consult a financial advisor before engaging in such trading activities.
Axis Direct Disclaimer This is for educational purposes only. Axis Direct is a brand under which Axis Securities Limited offers its. Retail broking and investment services. Investments in the securities market are subject to market risks. Read all the related documents carefully before investing. Disclaimer & Statutory Information
Technicals
Options
Call Centre
Put Option
Futures
TechnicalAnalysis


 India
India NRI
NRI