


 India
India NRI
NRIAdvantage AxisDirect
- 20 investment products
- 3 great platforms to invest
- 5 fun-tastic learn courses
- 5 powerful research segments
- 4 prestigious awards
- 9 lakh+ happy investors
Quotes
Back To Menu
-
Offerings
- Overview
- Products
- DIGITAX
- Managed Accounts
- Private Client Group
- Business Associates
- NRI
- Refer & Earn
- Insurance
- SGB
- Investment Solutions
- Investment Advisory
- Markets
- Research
- Learn
- PORTFOLIO
- PROFILE
Series 24: Simple Moving Averages
Jan 24, 2025

Series 24: Simple Moving Averages
A Simple Moving Average (SMA) is a statistical calculation used in technical analysis to determine the average price of a security over a specific number of periods. It is calculated by summing the closing prices of the security for a defined time frame and dividing the total by the number of periods. The SMA smooths out price data to help traders and investors identify trends by reducing the impact of short-term fluctuations.
How to Calculate a Simple Moving Average (SMA)?
The formula for SMA is:
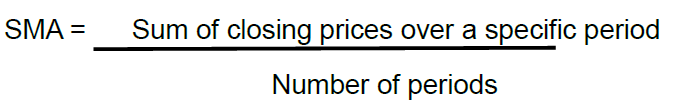
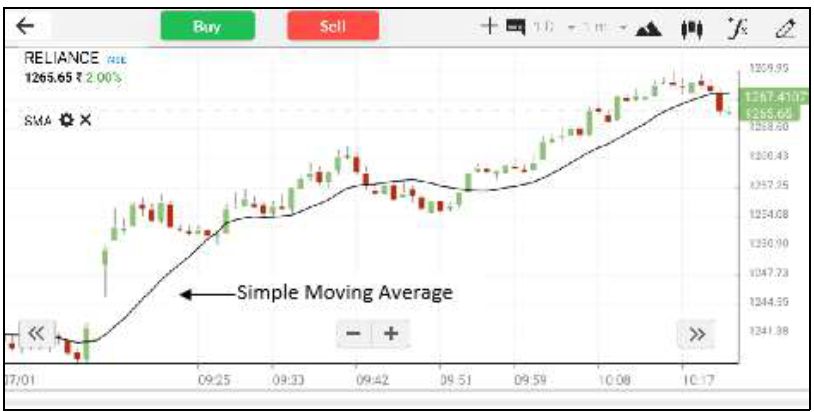
This calculation is repeated as new data becomes available, creating a smooth line that tracks the average price over time.Example: Reliance Industries (Revisiting the Moving Average Example)
Let’s revisit the example we used earlier when explaining the concept of moving averages. The closing prices of Reliance Industries for the past 5 days were as follows:
Day 1: ₹1200
Day 2: ₹1210
Day 3: ₹1225
Day 4: ₹1230
Day 5: ₹1215
To calculate the 5-day Simple Moving Average (SMA), we sum up the closing prices for these 5 days and divide by 5:
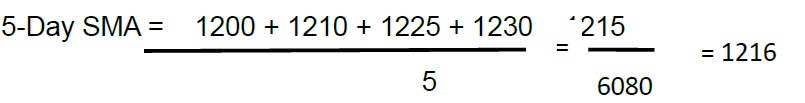
As we explained in the earlier article on moving averages, this value of ₹1216 represents the average price of Reliance Industries over the last 5 days, smoothing out the daily price fluctuations and providing a clearer picture of the trend.
What Happens When a New Day’s Price Is Added?
Now, let’s extend the same example to see how the SMA changes when a new day’s price is added. If the closing price on Day 6 is ₹1220, we drop the price from Day 1 (₹1200) and include the new price of Day 6 (₹1220). The updated set of prices is:
Day 2: ₹1210
Day 3: ₹1225
Day 4: ₹1230
Day 5: ₹1215
Day 6: ₹1220
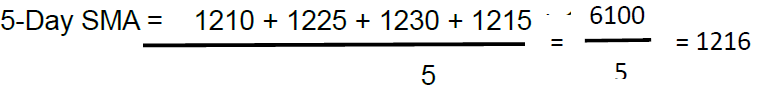
As we saw in the earlier discussion, the SMA has increased from ₹1216 to ₹1220, reflecting the upward trend in prices. This dynamic adjustment of the SMA is what makes it a valuable tool for identifying trends in both bullish and bearish markets.
By revisiting this example, we can see how the SMA builds on the concept of moving averages, providing a simple yet effective way to analyze price trends over time.
Key Characteristics of SMA
Trend Identification:
1. In a bullish market, prices tend to stay above the SMA, and the SMA itself moves upward.
2. In a bearish market, prices tend to stay below the SMA, and the SMA moves downward.
Sensitivity to Price Changes:
1. Shorter SMAs (e.g., 5-day or 10-day) are more sensitive to price changes and follow the price closely.
2. Longer SMAs (e.g., 50-day or 200-day) are less responsive and provide a smoother trend line.
Lagging Indicator:
Since the SMA is based on past prices, it is a lagging indicator and may not react immediately to sudden price changes.
Practical Use of SMA in Trading
1. Support and Resistance: Traders often use SMAs as dynamic support or resistance levels.
2. Trend Confirmation: A rising SMA confirms an uptrend, while a falling SMA confirms a downtrend.
3. Crossovers: Crossover of a shorter SMA above the longer SMA (e.g., 50-day SMA crossing above the 200-day SMA), signals a potential bullish trend, and vice versa.
By using SMAs, traders can make more informed decisions and reduce the impact of short-term price volatility.
Disclaimer: This information is for educational purposes only. Consult a financial advisor before engaging in such trading activities.
Axis Direct Disclaimer This is for educational purposes only. Axis Direct is a brand under which Axis Securities Limited offers its. Retail broking and investment services. Investments in the securities market are subject to market risks. Read all the related documents carefully before investing. Disclaimer & Statutory Information
Related Keyword
Technicals
Options
Call Centre
Put Option
Futures
TechnicalAnalysis
Similar Articles
Show more...