




 India
India NRI
NRIAdvantage AxisDirect
- 20 investment products
- 3 great platforms to invest
- 5 fun-tastic learn courses
- 5 powerful research segments
- 4 prestigious awards
- 9 lakh+ happy investors

Quotes
Back To Menu
-
Offerings
- Overview
- Products
- DIGITAX
- Managed Accounts
- Private Client Group
- Business Associates
- NRI
- Refer & Earn
- Insurance
- SGB
- Investment Solutions
- Investment Advisory
- Markets
- Research
- Learn
- PORTFOLIO
- PROFILE
Series 27: RSI
Jan 27, 2025

Series 27: RSI
What is the Relative Strength Index (RSI)?
The Relative Strength Index (RSI) is a popular momentum oscillator used in technical analysis to measure the speed and change of price movements. Developed by J. Welles Wilder, RSI is a bounded indicator that oscillates between 0 and 100, helping traders identify overbought or oversold conditions in the market. It is widely used to assess the strength of a trend and potential reversal points.
The key idea behind RSI is that prices are considered overbought when the RSI is above 70 and oversold when it is below 30. However, these levels are not absolute and should not be used in isolation. RSI works best when combined with other technical indicators and trend analysis for confirmation.
How is RSI Calculated ?
The RSI is calculated using the following formula:
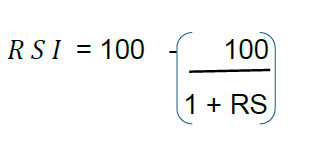
RS = Average Gain / Average Loss (over a specified period, typically 14 days)
Steps to Calculate RSI:
1. Calculate the Average Gain and Average Loss:
- ● Average Gain = Sum of all gains over the period / Number of periods
- ● Average Loss = Sum of all losses over the period / Number of periods
2. Calculate the Relative Strength (RS):
- ● RS = Average Gain / Average Loss
- ● Plug RS into the RSI Formula:
- ● RSI = 100 - (100 / (1 + RS))
Let us revisit the Example: Reliance Industries
Let’s assume the closing prices of Reliance Industries for the past 7 days were as follows:
Step 1: Number of Days
- ● Day 1: ₹1200
- ● Day 2: ₹1210
- ● Day 3: ₹1225
- ● Day 4: ₹1230
- ● Day 5: ₹1215
- ● Day 6: ₹1220
- ● Day 7: ₹1235
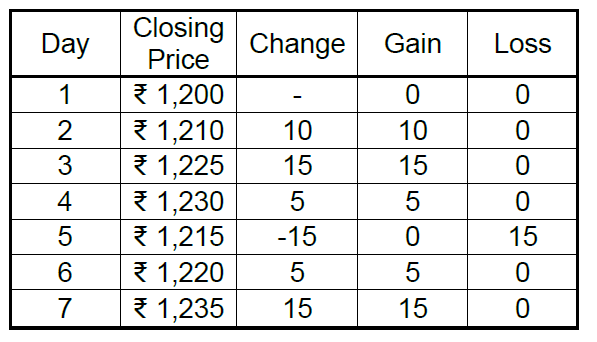
Step 2: Calculate the Average Gain and Average Loss Using a 7-day period:
- ● Average Gain = (10 + 15 + 5 + 5 + 15) / 7 = ₹7.14
- ● Average Loss = (15) / 7 = ₹2.14
Step 3: Calculate the Relative Strength (RS)
-
● RS = (Average Gain / Average Loss)
= (7.14 / 2.14)
= 3.34
Step 4: Calculate the RSI
RSI = 100 − (100 / (1 + RS))
RSI = 100 − (100 / (1 + 3.34))
RSI = 100 − (100 / 4.34)
RSI = 100 − 23.04
RSI = 76.96
Thus, the RSI for Reliance Industries is 76.96, indicating that the stock is in the overbought zone.How to Interpret RSI?
1. Overbought and Oversold Levels:
- ● RSI > 70: The stock is considered overbought, which may indicate a potential reversal or pullback.
- ● RSI < 30: The stock is considered oversold, which may indicate a potential reversal or upward movement.
- ● The RSI can remain overbought or oversold for a prolonged period in a trending market.
- ● In a strong uptrend, RSI stays above 50 and often hovers between 40 and 80.
- ● In a strong downtrend, RSI stays below 50 and often hovers between 20 and 60.
- ● RSI Range Shift refers to the tendency of RSI to operate in specific ranges during trends: in a bullish trend, RSI stays between 40–80, with 40 acting as support, while in a bearish trend, RSI stays between 20–60 with 60 acting as resistance.
- ● RSI Range Shift helps confirm trends, identify entry/exit points, and avoid false signals. However, it should always be combined with price action and other indicators for better accuracy.
Disclaimer: This information is for educational purposes only. Consult a financial advisor before engaging in such trading activities.
Axis Direct Disclaimer This is for educational purposes only. Axis Direct is a brand under which Axis Securities Limited offers its. Retail broking and investment services. Investments in the securities market are subject to market risks. Read all the related documents carefully before investing. Disclaimer & Statutory Information
Related Keyword
Technicals
Options
Call Centre
Put Option
Futures
TechnicalAnalysis
Similar Articles
Show more...