

1,075.85
-1.45 (-0.13%)
Independent Research
Reuters
We bring you Independent research views from famous names like Reuters and theScreeners to help improve your investing results and create wealth
Performance parameters
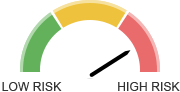
Risk parameters
-
Risk Zone

Moderate The stock has been on the moderate-sensitivity level since 03-Dec-2019. -
Bear Market
Average sensitivity to market corrections On average, the stock is likely to decline with the index. -
Bad News
Slight market sanction in case of specific pressure When the stock's pressure is specific, the market sanction on average is 259%. -
Beta
For 1% of index variation, the stock varies on average by 81%. -
Correlation
0.6018% of stock movements are explained by index variations. -
Value at Risk
The value at risk is estimated at 130.37. The risk is therefore 0.24000%. This value is based on the historical volatility for a medium time period (1 month) with a confidence of 95%.
Other parameters
-
LT Growth
The annualized growth estimate is for the current year to 2022. -
P/E Ratio
The estimated PE is for the year 2022. -
G/PE Ratio
A ratio (Forecasted Growth + Estimated Dividend Yield/ Estimated Price Earnings) below 0.9 indicates that investors must pay a premium for the estimated growth potential: 14.221% premium. -
Dividend Yield
The twelve month estimated dividend yield represents 47.442% of earnings forecasts. -
Global Evaluation

Slightly negative The stock is classified in the slightly negative zone since 01-May-2020.